Realtime Audio Returns

March 16th, 2016

I finally fixed streaming audio support (using the Web Audio API). The main streaming audio implementation was done already in Early 2011, using the Mozilla Audio Data API. However, this was Firefox only, and it was removed from Firefox builds in March 2014.

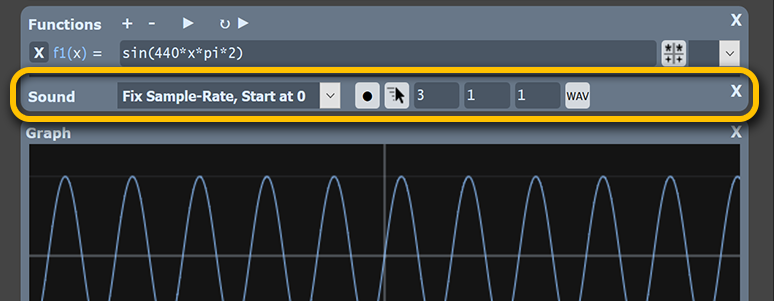
You can easily play all visible functions as sound in the functions panel, here is the realtime play button:

madtealab_realtimeplay


It uses the play options (sample length, rate etc) as the normal play function, but instead of rendering all at once and generating a wav file, it renders on the fly and keeps looping the area, so changes can be heard within a few milliseconds. The play options panel is expanded when you first press any of the play buttons:

madtealab_playoptions


So now it is once again possible to play around with this old example:

Prototyping layouting algorithm

March 31st, 2015

I just wrote an article about layouting,
check it out if you want some context!

If not, then here’s a simple demonstration of a layouting algorithm, try it out in Mad Tea Lab, or just check the video:

Graphing Infinity

November 4th, 2014

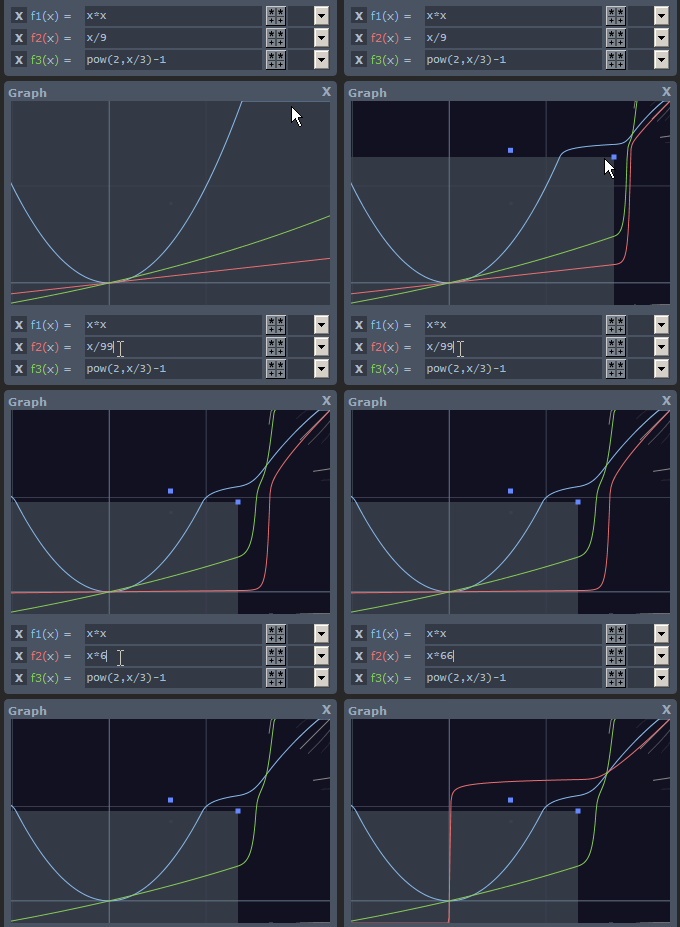
When plotting functions that grow rapidly such as exp and pow, it’s hard to get a sense of overview despite good scrolling and zooming tools. Why can’t we just graph it all?

The obvious answer is of course that there is way too much space, but isn’t it more fun to answer with another question:

-How can we warp that space to get as much useful information as possible?

Conceptually I figured that a warp could reveal the different types of functions, like this:
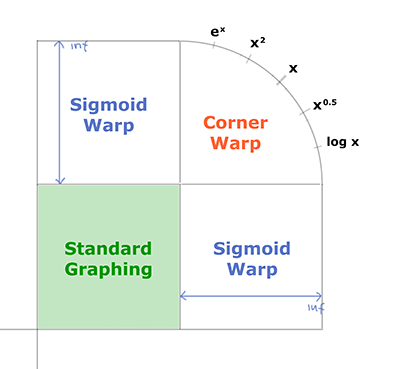
concept sketch

And… it works!

gif anim

(note that you can click any screenshots to open the interactive lab in Mad Tea Lab)

Using the infinity graphing mode

It’s activated by just dragging in the top right corner, and drag the bottom left corner to enable negative infinity graphing (hold down alt-key for symmetry). If you double-click anywhere on the graph, the view will center on that point. The markers (gray lines) in the corners are just showing you basic functions:
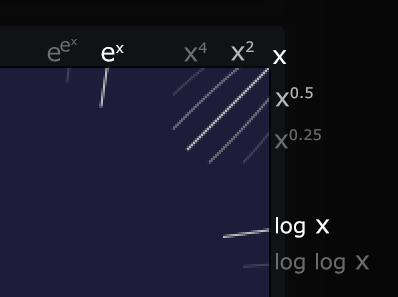
markers

You can look at the visual similarity to see what type your function behaves like. For example, lets say way have 1.1^x and x^29. Even though x^29 crosses the gray exponential marker, it is clearly not as steep.
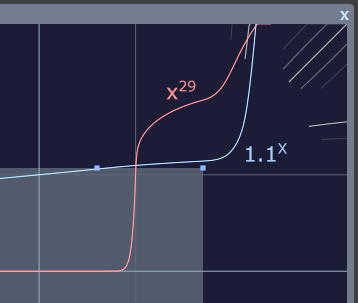
example 1

The example below shows how extreme scalings of linear and quadratic functions still sort themselves into the correct categories in the corner:
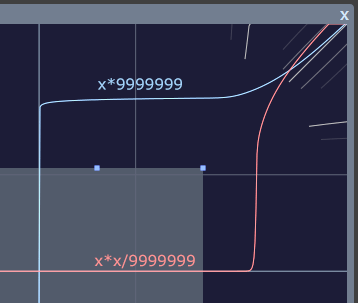
example 2

It could also be used to compare extreme functions and see intersections etc.
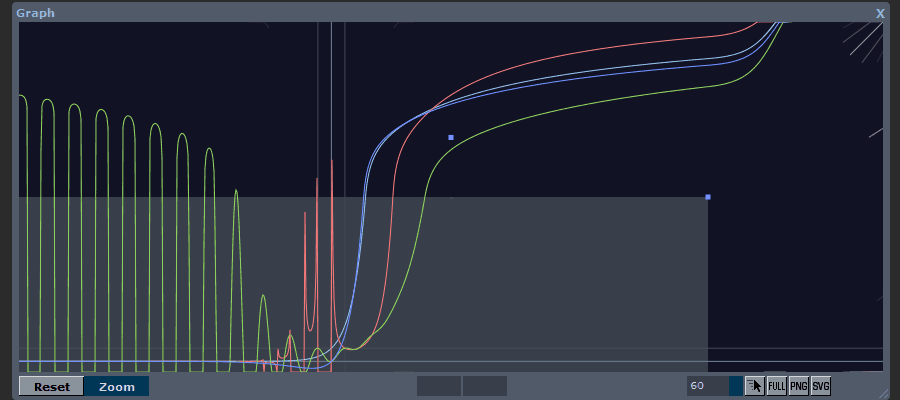
compare

This feature also work with the relevant function rendering styles:
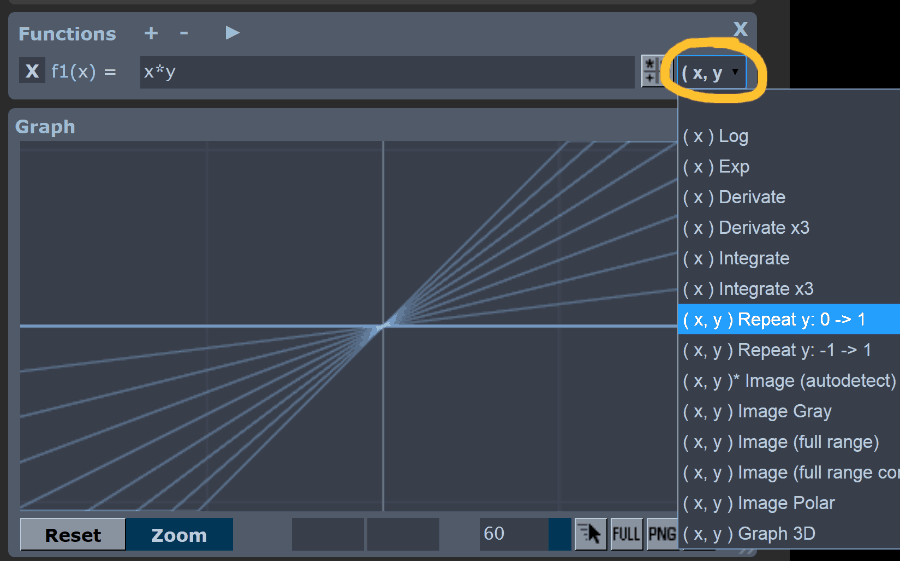
rendering styles

For instance, here I use the “Repeat y” plot to see how the infinity corner area gets filled by the different base functions:
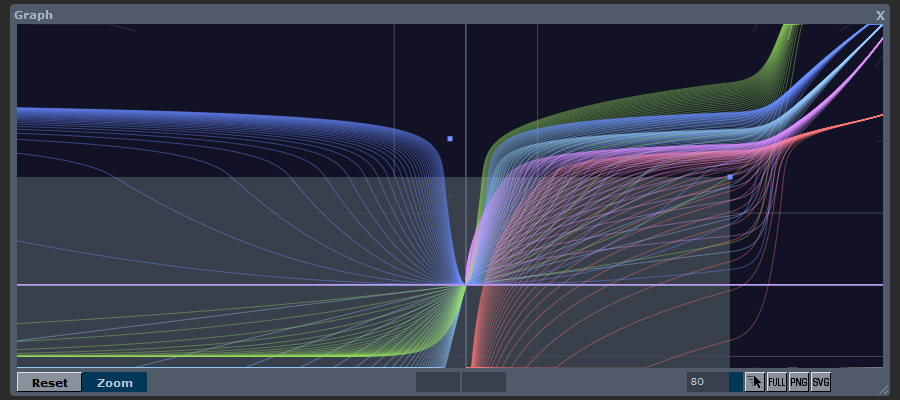
colorful

Happy Tau Day!

June 28th, 2013

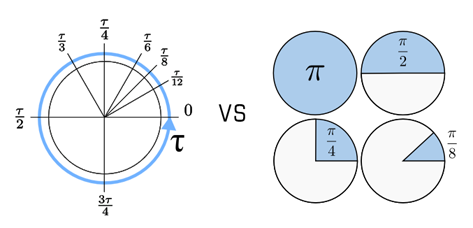
Did you hear about the pi vs tau debate yet?

Tau vs Pi
It’s not a big deal, my limited excursions of the world of mathematics gives me a slight preference for tau over pi. It’s like chosing between overall-ugliness (it’s ugly with two definitions for the same thing) or domain-ugliness (“wrong” constants gives uglier formulas). I came up with an interactive madtealab example to show the profoundness of tau in the domain of derivation:

Check it out!

Note that triple derivation is also implemented as a graphing mode, so this is how I’d do it hacker-style.

(by the way, tau is now defined in madtealab!)

11 11 11

November 11th, 2011

Another nice date passes by… 🙂

Today I thought I would show how Mad Tea Lab can be used to prototype audio effects in realtime. Note that the song might need some time to load. Here is the lab, or, just check out the video below!


(Note: Initially this feature used the Audio Data API, and because of that it only worked in Firefox)

Five Colorful Options

July 29th, 2011

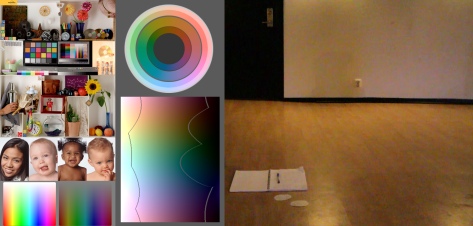
Making an image more (or less) colorful seems like an easy task. But in order to make the colorfulness respond as we expect it to, we need to take human perception into account. A nice way to evalute color-functions is to use gradients that appear to have the same intensity and colorfulness. There is also a sophisticated perceptual model called CIECAM02 that can be used for reference (here is a useful CIECAM02 photoshop plugin). Below is a small tool to compare ways of changing colorfulness. It’s the same source image processed in photoshop using different methods.

Compare for yourself

Hover mouse over the link captions below to compare, click to “lock” an image (hover response might initially be slow due to image loading). You can also compare in high-res.

Desaturate

Saturate

Hue/Sat. Dialog – Saturation
Vibrance Dialog – Vibrance
Vibrance Dialog – Saturation
Channel Mixer Dialog
CIECAM02, Chroma * 0

( Original )
Hue/Sat. Dialog – Saturation
Vibrance Dialog – Vibrance
Vibrance Dialog – Saturation
Channel Mixer Dialog
CIECAM02, Chroma * 1.4

( Original )

For another comparison, check mark meyer’s blog it also has some scatter plots.

Hue/Saturation Dialog – Saturation

  • This method has several “dead areas” where colorfulness cannot be increased (where any color-channel is 0 or 255), here are some examples:
    • 004e4a (0,78,74)
    • a2bdff (162,189,255)
    • ffb7ad (255,183,173)
  • Colors close to “dead areas” have a limited saturation span.
  • Increasing colorfulness will also increase the perceived brightness of the colorful areas.
  • Technically this seems to be a plain HSL (bi-hexcone) implementation.

Vibrance Dialog – Vibrance

  • Vibrance increases colorfulness so that vivid colors are boosted less and faded colors are boosted more.
  • Colors close to red are bosted less (the intent is to retain skin colors according to the manual).
  • Using vibrance -100 will not fully desaturate and dark colors will be retained more than light ones.
  • Calculation involves a HSV/HSL-like space*.
  • An interesting side-effect of desaturating vibrance is that the colored parts of the image get a kind of S-curve applied to it, increasing the contrast of the desaturated material. This often looks quite good (see below), though it can cause some clipping of bright colors.
    Hover mouse here to see Vibrance -100
    Hover mouse here to see Grey (CIECAM02)

Vibrance Dialog – Saturation

  • Overall, this algorithm is a very nice improvement over the older Hue/Saturation dialog, since it seems to be gamma corrected, and calculation is not done in HSV/HSL space*. Result is quite similar to CIECAM02.
  • Colors are mixed to grey using about 28% 72% 0% (and then interpolated in linear RGB), which is close to perceptual standards.
  • Bluish images might appear darker after desaturated (and using saturation -100 will discard all blue information).
  • Saturation values are somewhat counter intuitive, if you saturate by -33 you have to saturate by 50 to get back to the original level. Though it is mathematically correct if you think in percentages; (1 – 0.33) * (1 + 0.5) is about one.

Channel Mixer Dialog

  • Increasing colorfulness will also increase the perceived brightness of the colorful areas.
  • Quite smooth and consistent, might be useful if you don’t have access to vibrance color controls.
  • Mixer values (+120 -10 -10, -10 +120 -10, -10 -10 +120)
  • Mixer values used for grey (+30 +60 +10 Monochrome)

* HSV/HSL color space is strikingly perceptually inconsistent, an extreme example is that it treats these two colors as having the same brightness:

0000FF (0,0,256)

FFFF00 (256,256,0)

Artifacts from the HSV/HSL transforms can be seen in the comparison tool, such as unsmooth gradients and increased noise (clearly visible in a still image from Canon D7 footage with a high ISO setting). Also note that, for most images these inconsistencies do not pose any major problem.

Happy New Year Again!

February 3rd, 2011

So it’s Chinese new year, and what animal?
The Rabbit! And what kind of association could
this bring to an oldschool 3D hacker?
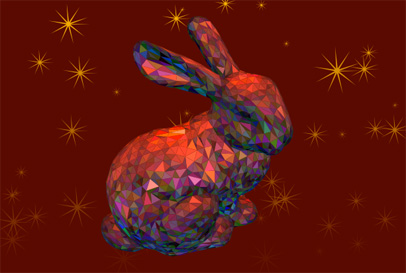
Yeah, you got it! Of course it’s the Stanford Bunny!
So this is todays Mad Tea Lab exercise!
Parsing and rendering the good old bun in 3D!

stanfordbunny

Merry Christmas 2010

December 24th, 2010

christmas2010


(check it out)

10 10 10 10 10

October 10th, 2010

colordisco

Check out this old school sinus animation!

I just had to write a blog entry since it’s 10/10/10!

But also, there are a few features that I’ve worked on lately but been too lazy to blog about, so this seems like a good opportunity! Here’s the list:

Music video with Mad Tea lab

May 3rd, 2010

This is a video made from animation rendered in Mad Tea Lab mixed with some footage I shot at Tore Jarlos studio in Stockholm. The music is Tores remix of Dear Martins song called “We Are”.

Here is a lab if you want to play!

If you’re interested in rendering animation with Mad Tea Lab read more here…